April 2, 2022
EUR/USD: Too Much Uncertainty
- The movement of major currencies was determined throughout March by reports from the Russian-Ukrainian front, the sanctions-energy war with Russia, and the pace of monetary tightening. The US dollar has strengthened significantly in recent months thanks to a sharp increase in the yield of US government bonds and signals about an increase in the Fed's interest rate. The EUR/USD pair fell to 1.0805 on March 07, its lowest level since mid-May 2020. However, then the growth of the dollar stopped, and the pair moved to a sideways movement along the Pivot Point 1.1000. The hawkish statements of the Fed management pushed the pair down, the hopes for resolving the armed conflict between Russia and Ukraine sent it above this line.
The same factors determined the dynamics of EUR/USD last week as well. The pair rose by 240 points from Monday, March 28 to Thursday, March 31: from 1.0944 to 1.1184. First, the strengthening of the euro was caused by reports in the US media that the ECB may start actively raising the refinancing rate this year. Allegedly, a number of large market participants require the European regulator to raise the rate four times by the end of 2022. As a result, investors began to include in quotes the probability of such a move by the ECB, and the yield on government bonds in Europe went up.
The next day, March 29, hopes dawned for the success of the peace talks between Russia and Ukraine, which took place in Istanbul (Turkey). The success of the EU's energy war with Russia also helped the European currency. Russian President Vladimir Putin signed a decree on the sale of energy carriers to Europe exclusively for rubles a week ago. The goal was clear: to support the ruble exchange rate under the sanctions. However, the main European consumers refused to do so categorically, and the head of Russia was forced to note his decision.
Everything would have been good for the euro, but it turned out in the second half of the week that the rumors about the increase in the EUR rate in 2022 are nothing more than a speculation, and that there was no serious shift in the negotiations in Istanbul. Macroeconomic statistics also helped the dollar a little. As a result, the growth of the EUR/USD pair stopped, it turned south and ended the five-day period not far from Pivot Point 1.1000, at the level of 1.1045.
The outcome of the hostilities in Ukraine is still unclear. The situation with the supply and payment of hydrocarbon raw materials to Europe remains confusing as well. Oil has fallen in price by about 14% since March 24. This is how the market reacted to the plans of President Joe Biden to sell additional volumes of oil from national reserves. The White House intends to sell up to 1 million barrels of oil per day over the next six months. And this could be the biggest sell-off in the nearly 50-year history of the US Strategic Petroleum Reserve. It should be noted here that, despite the smaller volumes, the sale of oil brings Russia more profit than gas currently. And such a decision by the United States should reduce Europe's dependence on Russian energy carriers, causing additional damage to the Russian economy.
Another uncertainty is introduced by the Fed. Recall that forecasts for US GDP have been recently revised. And they have shown that the regulator expects economic growth to slow down in 2022 from 4% to 2.8% due to the sanctions war with Russia. In addition, the forecasts for the interest rate have also changed. It was earlier said that it will reach 0.75-1.00% by the end of the year. This figure has now risen to 1.75-2.00%. Given that there are only six meetings left this year, it turns out that the FOMC (Federal Open Market Committee) will have to raise the rate by 0.25% at each of them.
But this is not all either. The forecast on the rate for the end of 2023 has also been raised from 1.50-1.75% to 2.75-3.00%. Moreover, it seems that we will face several more acts of monetary restriction in 2024. That is, this is not just a revision of forecasts, but a sharp tightening of the US monetary policy, which could deal a serious blow to the labor market and lead to a large-scale recession. The market may receive important signals about the future movement of the dollar on Wednesday, April 6. The minutes of the March FOMC meeting will be published on this day.
At the moment, 50% of analysts vote for the strengthening of the dollar. 40% vote for the growth of the EUR/USD pair and 10% have taken a neutral position. Among the oscillators on D1, the picture is mixed: 30% of them are colored red, 20% are green and the remaining 35% are gray neutral. The trend indicators have an advantage on the side of the red ones: those are 85% against 15% of the green ones.
The nearest target for the bulls is a breakdown of the resistance zone in the area of 1.1100-1.1135, followed by the zones of 1.1185-1.1200, 1.1280-1.1350 and highs on January 13 and February 10 in the area of 1.1485. As for the bears, they will certainly try to break through the support of 1.0950-1.1000 and drop 100 points lower. If successful, the next targets will be the March 07 low at 1.0805 and the 2020 low at 1.0635 and the 2016 low at 1.0325.
Apart from the publication of the minutes of the March FOMC meeting, there will be relatively few events in the coming week. We can highlight the publication of the ISM PMI in the US services sector on Tuesday, April 05, as well as data on retail sales in the Eurozone on Thursday, April 07.
GBP/USD: Trend east, along 1.3100
- Statistics from the United Kingdom last week turned out to be rather contradictory. According to the data published on Thursday, March 31, the British economy for the Q4 21 grew by 1.3%, which was higher than both the previous 1.0% and the forecast of 1.0%. The economy grew by 7.5% over the past year, which was the highest since 1941. But it is necessary to take into account here that GDP fell by 9.4% in 2020. So, there has not yet been a final recovery to the pre-pandemic level. In addition, data on the country's current account for the Q4 21 amounted to 7.3 billion pounds against the forecast of 17.6 billion and the previous value of 28.9 billion.
The activity of the manufacturing sector in the UK was also less than expected, which was confirmed by a IHS Markit report on Friday, April 01. The Purchasing Managers' Index (PMI) was 55.2 in March against the forecast of 55.5.
As with the euro and for the same reasons, GBP/USD investors and traders are at a loss. As a result, the pair was moving east along the 1.3100 level in a narrow corridor throughout the week. The low of the week was fixed at 1.3050, the high was 1.3182, the last chord sounded at 1.3112.
Giving a forecast for the coming week, 55% of experts side with the bulls, 35% support the bears and 10% remain neutral. The median forecast still points to the 1.3100 horizon. True, when moving to the forecast for the whole of April, its value rises to the zone of 1.3235. Most trend indicators on D1 point north. Among the oscillators, 55% are colored red, 20% are green and the remaining 25% are gray neutral. Trend indicators, as in the case of EUR/USD, have an overwhelming advantage on the side of the red ones: those are 90%.
The nearest support is located in the area of 1.3080-1.3100, then 1.3050 and the low of March 15 (and at the same time of 2021-2022) - 1.3000, followed by the support of 2020. Resistance levels are 1.3160, 1.3190-1.3215, then 1.3270-1.3325, 1.3400, 1.3485, 1.3600, 1.3640.
Among the events related to the economy of the United Kingdom, we can highlight the speech of the Governor of the Bank of England Andrew Bailey on Monday, April 4, as well as the publication of the Composite PMI and the Business Index UK services activity on Tuesday, April 05, and the Construction PMI on Wednesday, April 06.
USD/JPY: 125.09: No More Anti-Records?
- The yen breaks an anti-record after an anti-record. The USD/JPY hit 122.43 on Friday, March 25, and it was already 263 points higher at 125.09 on Monday, March 28. The reason for the continued weakening of the Japanese currency is the same: the Bank of Japan, which does not want to change its super-soft monetary policy. Its head, Haruhiko Kuroda, once again stated on March 22 that it was too early to discuss the possibility of curtailing the quantitative easing (QE) program, as well as raising the interest rate. Recall that it has been at a negative level for a long time, minus 0.1%. In addition, the regulator was actively buying Japanese government bonds (JGB) throughout the past week in a desperate attempt to prevent their yield from breaking through the target level of 0.25%.
Last week's high of 125.09 is already close to the 2015 high of 125.86. And if the pair manages to break higher, then, according to strategists at Credit Suisse, this will open the way for it to 135.20 in the long term, and then even higher, to the zone of 147.00-153.00. However, in their opinion, the correction that has begun now can be continued during the Q2, first to 119.79, then to 119.09, after which the pair will move to trading in the range of 119.00-125.00. Credit Suisse also believes that if the pair breaks through support at 119.09, then the pullback may become deeper, to the zone of 116.35-116.50.
The same high for the Q2 is called by Rabobank specialists, who predict the pair's rise above 125.00 only in the second half of this year. They believe that the tightening of the Fed's policy is already built into the current dollar quotes, and this will hold back the growth of the pair in the coming months. However, the difference in interest rates and Japan's position as an importer of raw materials will play their role in Q3 and Q4, and the yen will continue to gradually weaken. A quick jump in USD/JPY above 125.00 will seriously increase the likelihood that the Bank of Japan will revise its quantitative easing (QE) program.
As for the past week, after the pair rose to 125.09, a correction began. The low was recorded on Thursday, March 31 at 121.27, after which the pair went up again and finished at 122.54.
With 50% of experts giving a bullish outlook for the coming week, it looks very moderate and sees the pair rising to the 124.00-124.50 zone as a target. 25% of analysts, on the contrary, vote for a further decline in the pair, and 25% have taken a neutral position. It should be noted that when switching to a monthly forecast, the vast majority (85%) of experts predict the strengthening of the Japanese currency and expect to see the pair in the 115.00-117.00 zone.
Among the indicators on D1, there is almost complete unanimity after such a powerful breakthrough to the north. 90% of trend indicators and 100% of oscillators are looking up, although 25% of the oscillators are already in the overbought zone. The nearest resistance levels are 123.20, 124.20 and the March 28 high at 125.09. After that, as already mentioned, the bulls may try to reach the 2015 high at 125.86. The nearest support is 122.00, then 121.30. It is followed by zones 120.60-121.40, 119.00-119.40, 118.00-118.35.
There are no expected releases of any important statistics on the state of the Japanese economy this week.
CRYPTOCURRENCIES: What Whales and Short-Term Speculators Do
- Investors' risk appetite, which caused the growth of stock indices, continued to pull the crypto market with it at the beginning of last week. Bitcoin gained 28% and ethereum gained nearly 40% in just the second half of March.
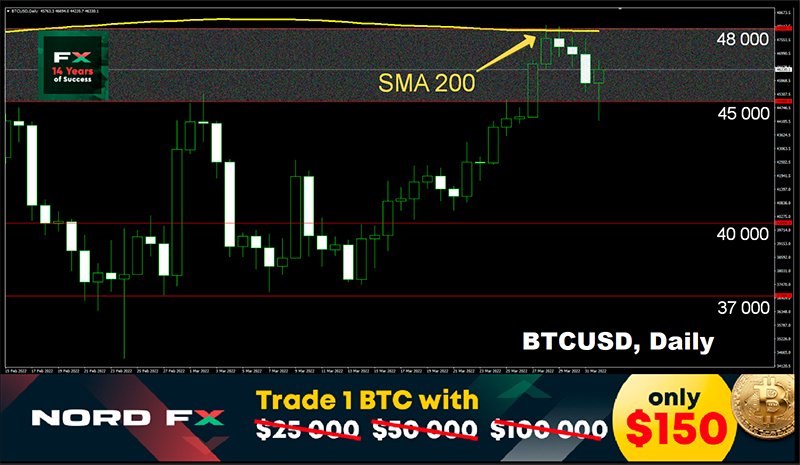
The main cryptocurrency reached the powerful resistance level of $45,000 on the evening of Friday, March 25, for the fifth time since the beginning of the year. It failed to gain a foothold above it the previous four times, the BTC/USD pair rolled back down. This time it seemed that the bulls finally achieved the long-awaited victory: the quotes recorded a local high at a height of $48.156 on March 28. However, after that, the pair hit the 200-day SMA and stopped rising. The most logical explanation for this stop is the strengthening of the dollar at the end of the past week.
At the time of writing, April 01, the flagship cryptocurrency first returned to the $45,000 zone, which turned from resistance to support, and then rebounded to $46,500. The total market capitalization rose to $2.140 trillion ($1.995 trillion a week ago). The Crypto Fear & Greed Index has also grown slightly: from 47 to 50 points.
DataDash CEO Nicholas Merten believes that short-term investors and traders with leverage influence bitcoin volatility, and “whales” influence the growth. “There has been a lot of panic around the macro environment over the past couple of months,” Merten writes. The Fed is raising interest rates... The war between Ukraine and Russia, the potential next wave of COVID-19 - all these problems caused pessimism among small investors. At the same time, the “whales”, on the contrary, did not sell cryptocurrency... In fact, we saw how long-term investors continued to either buy more or hold bitcoin.
One such investor was the well-known software developer MicroStrategy. The company has recently received a $205 million loan secured by its own crypto assets. The loan was issued by the American bank Silvergate. The purpose of the loan is to buy bitcoins. According to the Bitcoin Treasuries website, MicroStrategy already owns 125,051 BTC worth nearly $6 billion. And “this loan,” said Michael Saylor, CEO of MicroStrategy, “is an opportunity to strengthen our position as a leader among public companies investing in bitcoin.”
Note that MicroStrategy is not the only company that provides crypto assets as collateral. For this type of loans, Silvergate Bank has a special SEN Leverage program, the total amount of obligations for which has already exceeded $570 million.
Despite numerous macroeconomic and geopolitical challenges, bitcoin is highly likely to enter the second half of a bear market, according to analysts at Glassnode. This is evidenced by the active accumulation of coins in the range of $35,000-42,000 and the absence of significant spending of bitcoins purchased in the Q1 2021. The share of BTC “aged” over a year has grown by 9.4% over the past eight months to close to a record 62.9%. The holders of these coins did not get rid of the asset in the face of two corrections of more than 50% in the last 12 months. The growth rate of this indicator is comparable to the market recovery in 2018-2019. And this may reflect increased investor confidence in bitcoin.
At the same time, analysts at Glassnode warn that the process of bottoming and investor capitulation in a bear market is often lengthy and painful. Therefore, they urge not to rush into ascertaining the end of the bear market.
A number of experts believe that a new strong correction to the south is only a matter of time. There are still no drivers for the rapid growth of quotations, and everything depends on the severity of the geopolitical situation and the dynamics of the global economic recovery. The $30,000 level may become the bearish target for the BTC/USD pair.
Peter Brandt, CEO of Factor Trading, calls for caution in optimistic forecasts. This legendary trader tweeted to his 629,400 followers that BTC’s recent move reminded him of April 2019 when the top cryptocurrency bottomed at $3,500, starting the first phase of its bull cycle. However, the expert emphasizes that even a technical breakthrough does not guarantee that the coin will repeat the 2019 rally.
“Charts DO NOT predict the future. The charts DO NOT even offer probabilities. Charts offer opportunities and are useful for risk management in a trading program. Chart patterns can either work, fail, or transform. If laser eyes reappear and BTC stops, be careful,” Brandt warns.
Crypto analyst alias Dave the Wave posted a comment saying that bitcoin is forming a larger ascending triangle on the weekly timeframe and could rise to its all-time high of $69,000.
We noted in the forecast for the last week of March that the position of ethereum is currently slightly better than that of bitcoin. The above growth figures are clear proof of this. Many investors are now buying ETH with BTC. In addition, the community is waiting for the long-awaited update to the ethereum mainnet. The Merge update is approaching rollout following successful testing on the testnet. Before its launch, more than $5.0 billion in ETH tokens had already been withdrawn from circulation as a result of burning. Since the burning reduces the overall supply of ethereum, this positively affects its price, contributing to the altcoin’s rally. Glassnode analysts have found that the volume of ethereum on exchanges has been declining in recent days. The inflow of this altcoin to the trading floors is 20% lower than its outflow, which creates the conditions for the formation of an ETH deficit.
The growth in the value of the coin is observed against the backdrop of the activation of the ten largest ETH addresses. Whales have accumulated up to 23.7% of the total ethereum supply, according to a new report from analytics firm Santiment. And they are not going to dump their assets, preferring to send ETH to offline storage. A similar trend was observed in the first half of 2017, after which we saw the famous altcoin run during the hype five years ago.
And at the end of the review, another piece of advice in our crypto life hacks section. Recall that we talk in it about the most interesting and unexpected ways to make money in this market.
Have you ever wondered what the toilet is for? We will tell you: to mine cryptocurrency! This is exactly what Gabriel Kozak and Dušan Matuska from Slovakia decided. As a result, they created the AmityAge mining farm, which runs on electricity obtained from human and animal waste. Dušan Matushka, said that "their devices run on methane, which is produced during the biodegradation process." Since there is no shortage of such waste in the foreseeable future, BTC mining on their farm is not dependent on rising global energy prices. Moreover, it takes place in an environmentally friendly way using renewable energy sources, which completely removes all claims against this industry.
NordFX Analytical Group
Notice: These materials are not investment recommendations or guidelines for working in financial markets and are intended for informational purposes only. Trading in financial markets is risky and can result in a complete loss of deposited funds.


